The New Standard in Executive Decision-Making

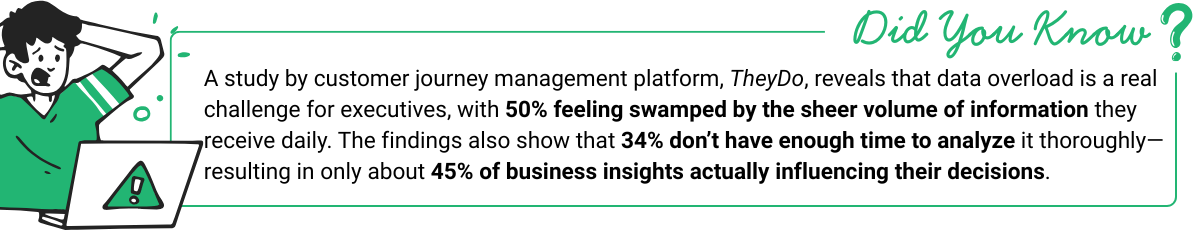
In today’s hyper-competitive market, executives face a relentless flow of data from multiple sources—financial reports, project updates, performance metrics, and market analyses. The challenge? Turning this data overload into clear, actionable insights to achieve project success. A centralized project dashboard is essential as it becomes the single source of truth for your team’s work. This is where an executive project dashboard becomes indispensable.
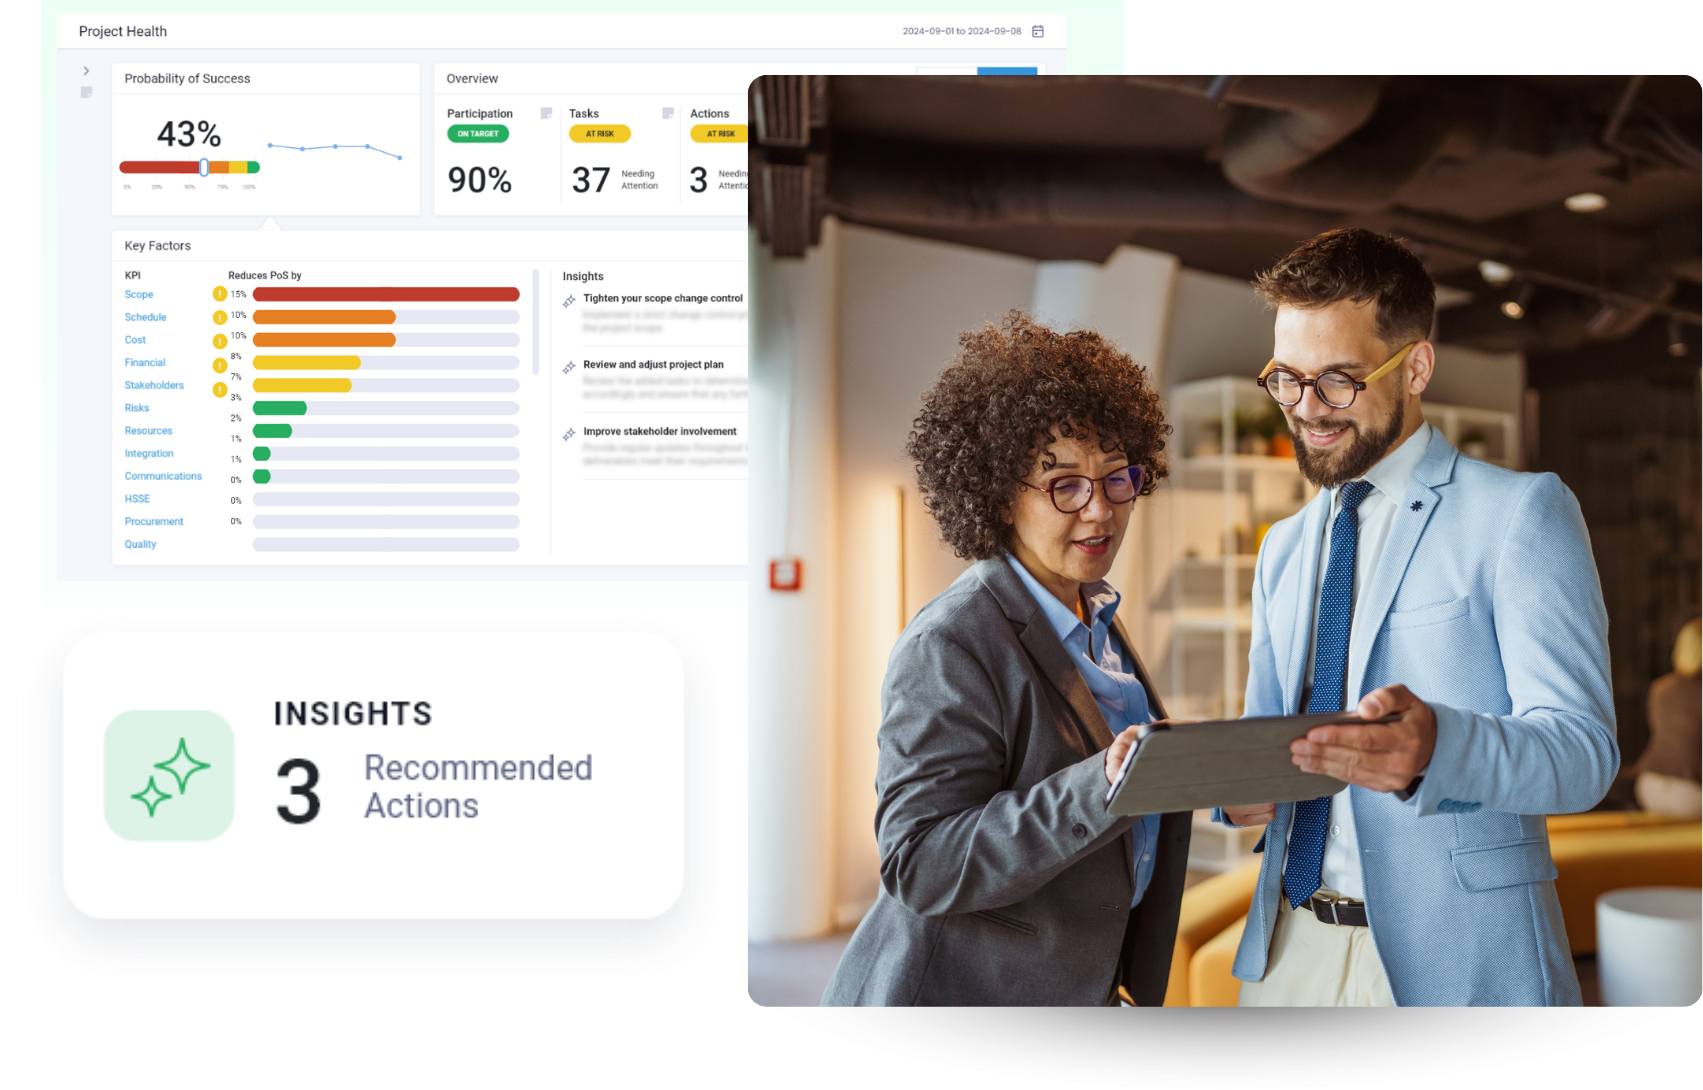
An executive project dashboard is more than a reporting tool. It’s a visual command center that consolidates key performance indicators (KPIs) and metrics to give decision-makers a real-time view of project health, up-to-date insights, resource allocation, and strategic alignment. However, manual updates like reminding team members to adjust an Excel sheet or move a task card often fail for three key reasons:
- The information may be outdated, since manual updates are easy to miss.
- Task progress details are scattered, making it difficult to see the whole picture.
- Team members can’t easily filter relevant data, which slows interpretation and action
Today’s technology offers countless ways to access real-time data. When information is consolidated into a single view, executives can more easily analyze trends and take informed, strategic action. Artificial intelligence-powered predictive analytics dashboards stop being static status boards and act as proactive advisors, forecasting risks, flagging bottlenecks, and highlighting opportunities before they impact outcomes.
This guide will explain an executive dashboard, outline its benefits for organizations, and share practical tips for creating one that delivers maximum value.
TrueProject gives executives a live, predictive view of project health. It pulls data from across your tools, flags risks early, and guides decisive action that drives success. See How It Works.
What is an Executive Project Dashboard?
An executive project dashboard is a high-level visualization tool that translates complex project data into a format C-suite leaders can instantly understand. It bridges the gap between raw data and strategic action, enabling executives to:
- Monitor project progress across portfolios in real time
- Identify trends and anomalies before they escalate
- Align initiatives with corporate goals and KPIs
- Make informed, high-impact decisions backed by evidence
Traditional dashboards summarize “what’s happening now.” Predictive dashboards go further, answering:
- What’s likely to happen next?
- Where are the hidden risks?
- What actions will prevent project failure?
Example: Instead of showing that a project is behind schedule, a predictive executive project dashboard highlights which dependencies are at risk, forecasts potential delays, and suggests corrective actions.
This ability to anticipate outcomes is only half the equation—executives also need those insights the moment they matter, which is where real-time dashboards come in.
Why Do Executives Need Real-Time Dashboards in 2025?
Executives rarely have the luxury of time to sift through dozens of reports. Critical opportunities and threats can arise in days or even hours. A real-time executive project dashboard ensures decision-makers always have the most current data, empowering them to:
- Respond immediately to changes in project status or risk levels
- Reallocate resources before bottlenecks disrupt timelines
- Maintain cross-functional visibility without endless update meetings
- Validate decisions with real-time performance data
According to the PMI's Pulse of the Profession report, 75% of projects are late or over budget, often because issues weren’t identified early enough. Predictive intelligence-powered real-time dashboards are your early-warning system, ensuring delays and overruns are detected before they spiral out of control.
See how TrueProject’s predictive intelligence turns real-time data into decisive action—so you can spot risks earlier, act faster, and confidently deliver results. Learn More Here.

To deliver this level of agility, real-time executive dashboards must be built on a clear framework that adapts to different leadership priorities while still providing consistent, actionable insights. This is where the four core pillars come into play.
The Four Pillars of Executive Dashboards for CEOs
One of the most significant advantages of an executive dashboard is its flexibility. No two leaders view their business in precisely the same way. The CEO of one organization may prioritize different KPIs than a counterpart elsewhere, and even executives within the same company often need unique perspectives. Still, most executive dashboards tend to fall into four key categories:
1. Strategic Dashboards
The strategic dashboards are ideal for CEOs, CFOs, COOs, and senior leaders steering corporate strategy. These executive project dashboards offer a high-level overview of progress toward long-term objectives. They help leadership teams monitor enterprise-wide KPIs, assess annual targets, and guide strategic decision-making. Typical elements include:
- Annual and year-over-year revenue growth trends
- Customer acquisition and retention rates
- Market share analysis
- Long-range financial projections
2. Analytical Dashboards
Analytical dashboards handle large, complex datasets to reveal patterns, correlations, and future trends. They are commonly used for financial modeling, competitive analysis, and market research. Common metrics include:
- Multi-year financial performance reviews
- Customer behavior and sentiment analytics
- Predictive sales and demand models
- Profitability analysis by product, region, or segment
Analytical dashboards are best for CFOs, CSOs, CMOs, and strategy-focused executives who depend on data-driven planning.
3. Operational Dashboards
Ideal for COOs, project leaders, and senior operations leaders, these dashboards focus on day-to-day performance and immediate execution. They provide live updates on essential business functions such as budgeting, production, and service delivery. Key indicators often include:
- Current project budget vs. actual spend
- Cost per acquisition and conversion rates
- Daily or weekly sales performance
- Customer service response and resolution times
4. Tactical Dashboards
Tactical dashboards are best for COOs, vice presidents, and executives responsible for operational alignment with strategic goals. They track detailed performance metrics to ensure teams execute leadership’s strategic vision effectively. Unlike operational dashboards, which focus on immediate activity, tactical dashboards assess productivity and process optimization over shorter cycles. Examples include:
- Employee productivity and performance benchmarks
- Progress on project milestones
- Engagement rates (clicks, impressions, cost per lead) for various marketing campaigns
- HR and recruitment metrics such as cost per hire and training ROI
Many organizations blend elements from all four to create a holistic executive dashboard that reflects their unique operational and strategic needs. Understanding the different types of executive dashboards is just the starting point—building one that truly drives decisions requires a deliberate, step-by-step approach.
5 Steps to Building a High-Impact Executive Project Dashboard
Creating a dashboard that delivers strategic value requires more than visual appeal. It must be designed around decision-makers' needs, the nature of the projects, and the organization’s strategic goals. Here's a roadmap to crafting a compelling and hard-hitting executive dashboard:
1. Know Your Audience
Every dashboard starts with understanding who will use it. Are you creating it for:
- The CEO, who needs a concise, big-picture overview?
- Project leaders, who require mid-level operational metrics?
- Project sponsors, who need progress updates tied to ROI?
Key questions to clarify:
- What decisions will this dashboard support?
- Which metrics matter most to this audience?
- How often will they consult it?
Tip: Avoid one-size-fits-all dashboards. Tailor the view for each stakeholder group to ensure relevance and engagement.
2. Define Actionable KPIs:
KPIs are the foundation of your project dashboard. For executives, the focus should be on metrics that drive decisions, not just numbers for numbers’ sake.
Examples of executive-level KPIs:
- Project delivery rate: Percentage of projects delivered on time and within scope
- Budget variance: Deviation from planned spend versus actual spend
- Portfolio alignment: Percentage of projects directly tied to strategic objectives
- Risk exposure: Number of projects flagged as high risk
Tip: Pair each KPI with context, such as a trendline, benchmark, or forecast, so executives see not just what is happening, but what it means.
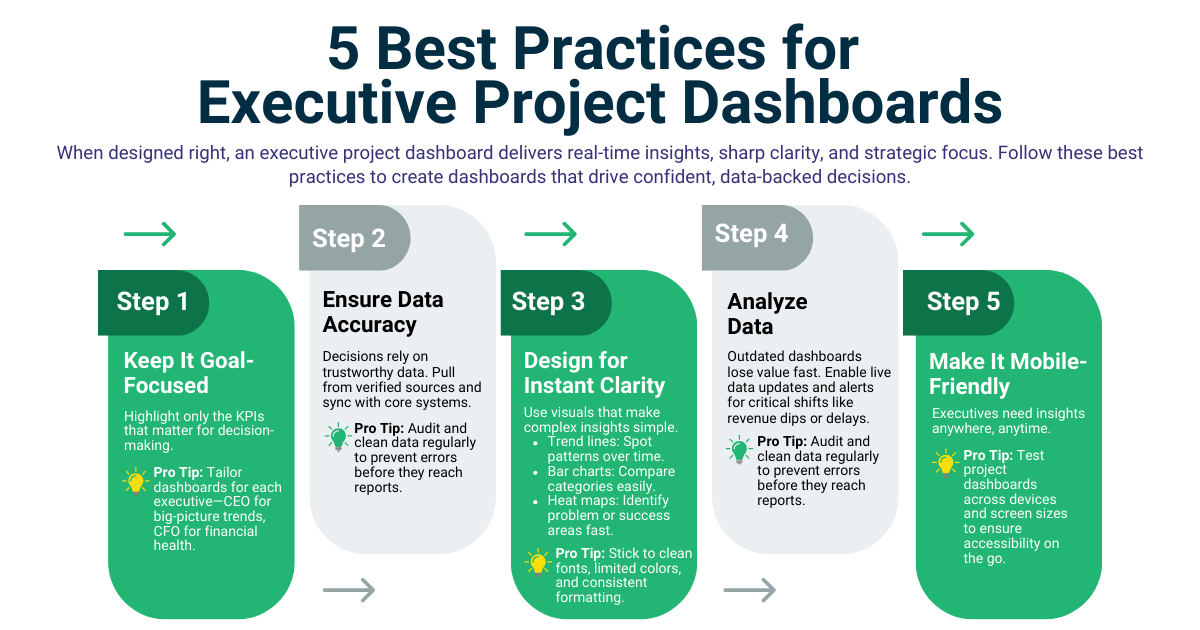
3. Design for Clarity and Speed
Executives make decisions quickly. Your project dashboard should deliver insights in seconds, not minutes.
Best practices for design:
- Limit each screen to 5–7 primary visualizations
- Use clear, intuitive chart types (line graphs for trends, bar charts for comparisons)
- Highlight anomalies with color cues
- Allow drill-down functionality for more detail when needed
Remember, visual clutter slows comprehension. Every element should serve a purpose.
4. Tell a Story with Data
An excellent executive project dashboard doesn’t just display data; it tells a cohesive story.
Your dashboard should answer:
- Are projects on track?
- Which initiatives are underperforming?
- Where do you need to reallocate resources?
- How are you progressing toward strategic milestones?
Example structure:
- Portfolio health overview — traffic light indicators for all major projects
- Key risks — top 3 risk factors impacting timelines or budgets
- Strategic impact — visualizing how projects contribute to business goals
- Action prompts — AI-driven recommendations for next steps
5. Integrate Predictive Reporting Solutions
Static dashboards offer hindsight; predictive dashboards deliver foresight. Modern predictive project management platforms can:
- Consolidate project data from multiple tools
- Run continuous health checks
- Trigger early warnings for at-risk projects
- Provide AI-generated recommendations for course correction
This ensures executives have the right information at the right time before small issues become costly failures. However, even the most well-designed executive dashboard can fail if certain pitfalls aren’t addressed. Understanding these challenges is critical to ensuring your investment delivers lasting value.
Experience how TrueProject’s predictive intelligence transforms your executive dashboard into a real-time decision engine—spot risks sooner, act faster, and deliver with certainty. Book Your Demo Now.

Common Challenges Executives Face with Dashboards
An executive project dashboard should serve as a company’s ultimate decision-making hub, offering leaders a real-time snapshot of projects’ performance. However, many C-suite dashboards fail to deliver on that promise. Instead of streamlining analytics, they often create frustration. Here are two key reasons why:
1. Data Silos and Integration Gaps
Dashboards are only as powerful as the data feeding them. When different departments operate in isolated systems that don’t integrate, executives are left with an incomplete or inconsistent picture. This fragmentation makes it harder to see how other business areas connect and influence one another.
2. Low Adoption and Usability Issues
No matter how advanced, a project dashboard is ineffective if leadership and their teams don’t use it. Common barriers include resistance to change, lack of proper onboarding, or overly complex interfaces. As a result, leaders may revert to outdated methods like static spreadsheets, manual report requests, or gut-based decision-making, undermining the executive project dashboard’s value.
Overcoming these obstacles requires more than better design—it demands a smarter approach powered by predictive analytics, capable of turning fragmented data and low adoption into strategic, forward-looking insight.
Why Predictive Analytics Transforms Executive Project Dashboards
 In the above sections, we have briefly discussed the impact of predictive analytics on managing projects and creating executive project dashboards. You may wonder why you must use AI-powered executive project dashboards and how they differ from traditional ones. Let’s understand how predictive analytics helps you reduce troubled or failed projects and gain more significant management insights.
Predictive analytics leverages data analysis techniques to forecast future outcomes, providing valuable insights like “What is likely to happen,” “What you must do,” and “How can a project execution solution help” for better decision-making across various business operations. This analytical approach enables businesses to detect patterns, anticipate future occurrences, and identify potential risks and opportunities. It is applicable across diverse sectors, offering a means to meet business requirements and comprehend market trends proactively.
Incorporating predictive analytics into your executive project dashboards enhances operational efficiency, optimizes revenue generation, and facilitates strategic decision-making. These actionable and intuitive insights, alongside aesthetically pleasing dashboards, simplify the process of data visualization, aiding in more precise and informed decision-making processes.
Isn’t this a great way to maximize your project and business success?
The Way Ahead
In a business environment where every decision can pivot the course of an entire project portfolio, executives cannot afford to rely on incomplete, delayed, or fragmented data. An effective executive project dashboard, especially those augmented with AI-powered predictive analytics, doesn’t just centralize metrics; it transforms them into a hub that keeps leaders steps ahead of risk and opportunity. By unifying real-time visibility, actionable KPIs, and AI-driven foresight, organizations gain the clarity, agility, and confidence needed to make bold, high-impact decisions when they matter most.
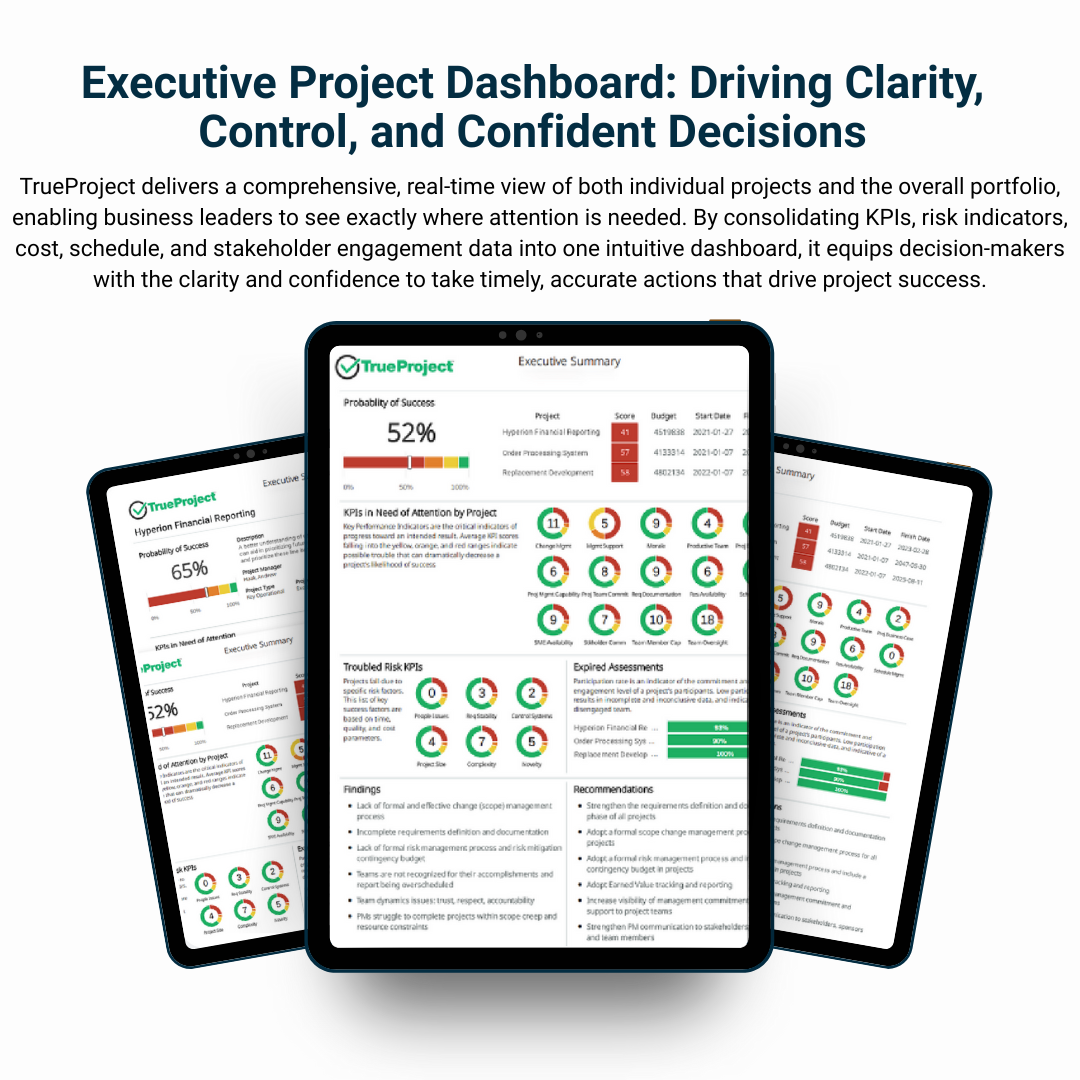
In doing so, these advanced dashboards transcend traditional data presentation, becoming invaluable assets that inform and actively shape the company's future direction. If you are looking for one such solution, look no further than TrueProject, a predictive intelligence solution for project health and performance.
TrueProject takes this vision further by integrating predictive analytics with comprehensive project health insights, ensuring executives get the “what” and the “what’s next.” Its AI-powered platform consolidates data from multiple sources, detects early warning signals, and delivers precise recommendations, empowering leadership teams to act before challenges escalate and consistently drive strategic success. The result? Fewer failures, reduced costs, and a decisive edge in achieving strategic success.
Ready to future-proof your projects? Discover how TrueProject’s predictive intelligence keeps your portfolios on track. Take your first step with a TrueProject Snapshot today.
FAQs on Executive Project Dashboards
1. What should be included in an executive project dashboard?
A balanced mix of KPIs covering project health, strategic alignment, budget, risk exposure, and forecasted outcomes.
2. How is a predictive executive dashboard different from a regular one?
Predictive dashboards use AI and analytics to forecast risks and opportunities, not just report current status.
3. How often should dashboards be updated?
Real-time or daily updates are ideal for executive decision-making, especially critical projects.
4. Can small businesses benefit from executive dashboards?
Absolutely. Even small organizations gain from having centralized, visualized project data for better decisions.
5. Which tools are best for building an executive dashboard?
Options include BI platforms like Power BI and Tableau, and predictive project management solutions like TrueProject.