

Quick Summary: Business improvement techniques provide a standard operating system for delivery. Pick a few initiatives with real upside, pilot quickly, embed what works, and use predictive signals to act before risks land. Govern with a 30–60–90 cadence so delivery is predictable, and benefits are verifiable.
Here’s the gap these methods close—and how to make them work without adding noise.
Even high-performing teams can slip. Recent PMI data shows organizations that offer 3+ capability enablers (e.g., mentoring, communities of practice) report higher project performance (76.7% vs 68.4%) and meaningfully less scope creep (28% vs 39%) and budget loss (25% vs 31%) than those with none. Big digital programs often cost more, take longer, and yield less than promised—not for lack of skill, but because the operating system for delivery isn’t fit for scale. Mature systems provide early warning signals and accurate, AI-driven recommendations—telling you exactly what to do: update a policy, adjust a Standard Operating Procedure (SOP), or trigger an automation—before results go off track. This pattern is echoed in PMI’s Pulse of the Profession 2024, where organizations with capability enablers outperform and see fewer execution losses.
What Business Improvement Techniques Mean for PMOs
Business improvement techniques are disciplined practices that standardize how work runs and how decisions are made—yielding fewer overruns, steadier velocity, stronger client experience, and a cleaner P&L. They replace ad-hoc fixes with one shared way of working across PMO, Delivery, Product, Finance, and Customer Success—teachable, repeatable, auditable.
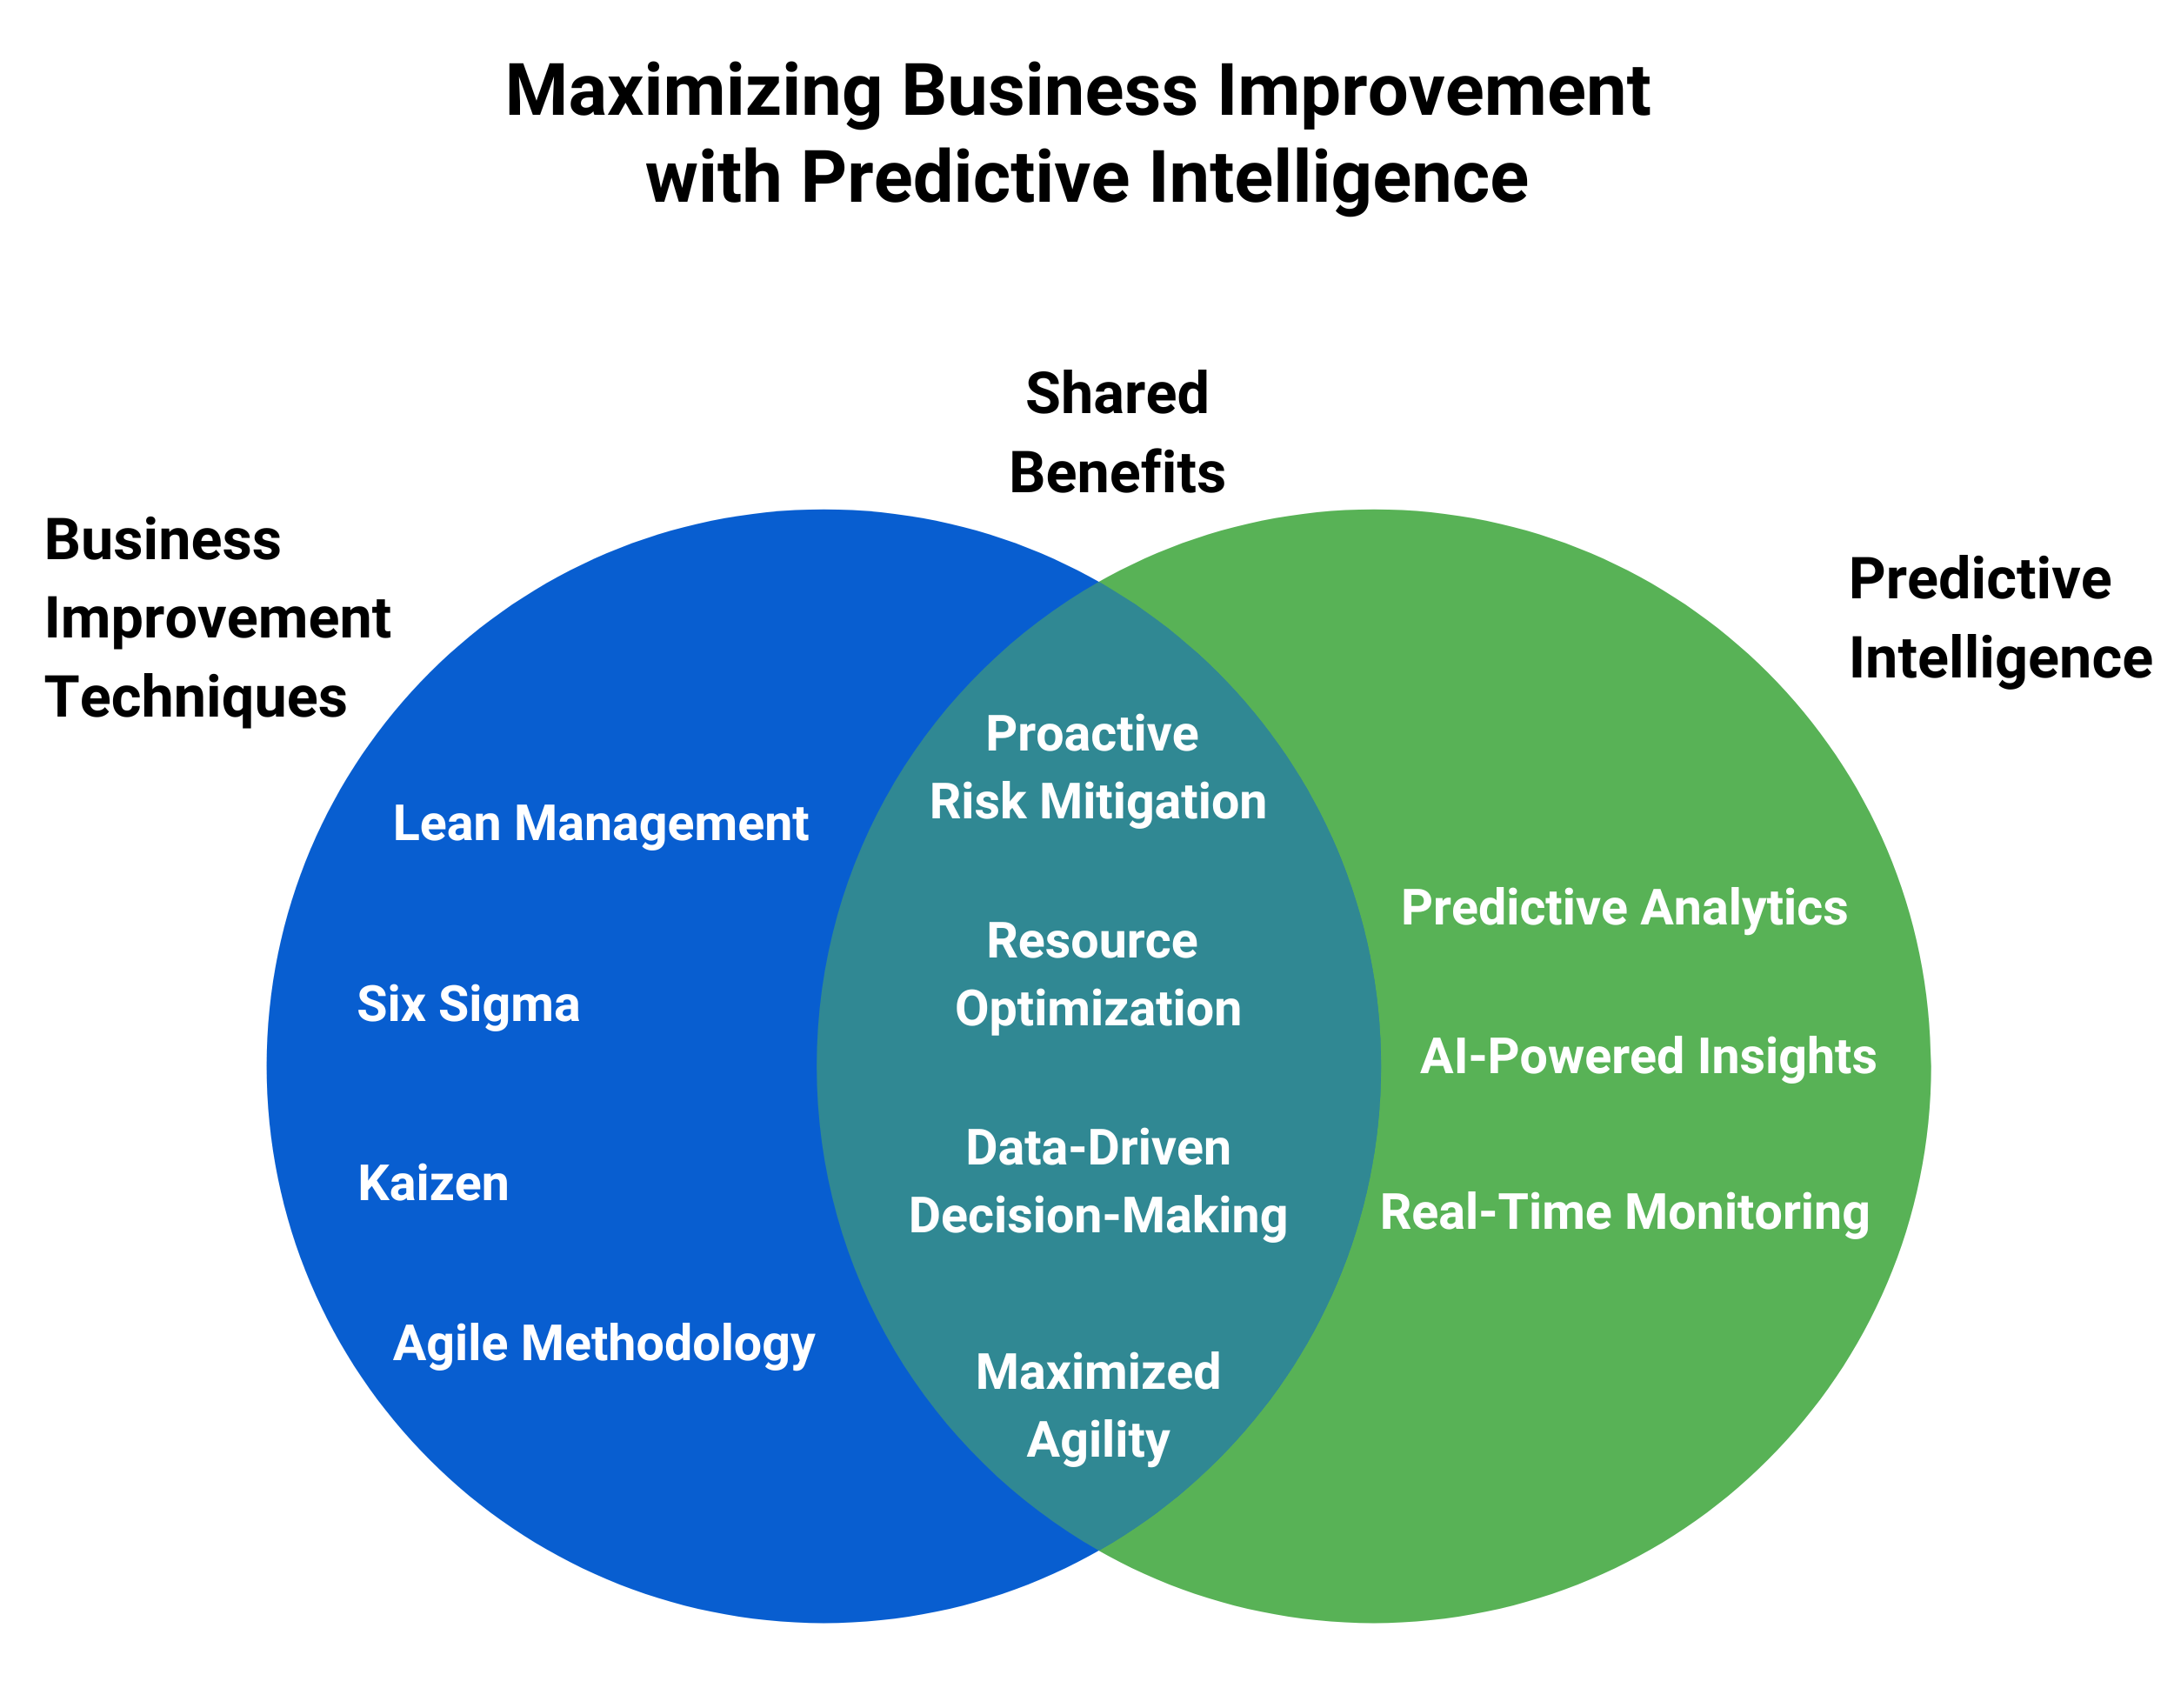
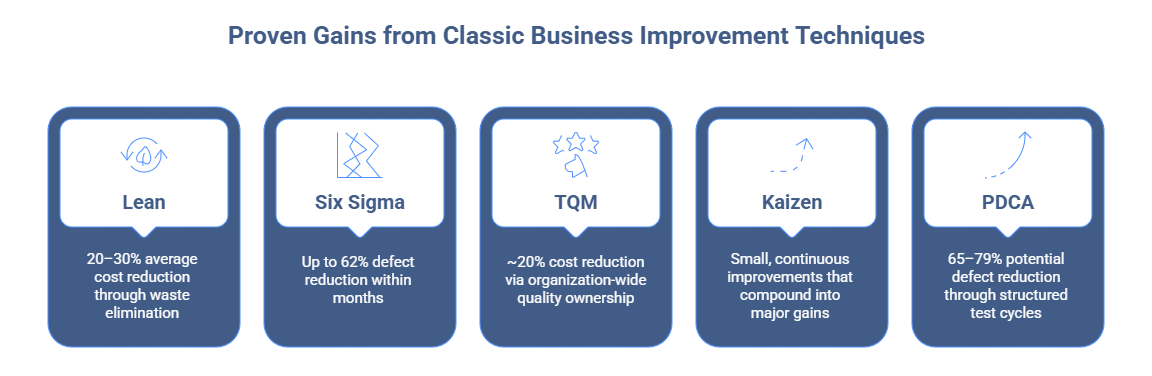
At their core are proven methods leaders already know:
- Lean (remove waste),
- Value Stream Mapping (VSM) (expose waits and handoffs),
- Plan–Do–Check–Act (PDCA) (test safely),
- 5 Whys (fix causes),
- 5S (Sort, Set in order, Shine, Standardize, Sustain) and visual management (make work obvious),
- Business Process Management (BPM)/Standard Operating Procedures (SOPs) (make wins stick),
- Kaizen (team-owned improvements), and
- Total Quality Management (TQM) (quality as everyone’s job).
These aren’t workshops; they’re the operating system of delivery.
Modern teams strengthen that system with predictive intelligence—forward-looking signals such as forecast-variance drift, queue aging, and stakeholder-sentiment shifts. The advantage is practical: risks surface early, countermeasures are predefined, and course corrections happen before outcomes slip.
How to tell it’s working. Reviews are straightforward: early warning signals are visible, delivery confidence is warranted, and when a signal bends, the next move—policy, SOP, or automation—is already defined. Run one tight loop: Select → Pilot → Check → Embed → Monitor → Validate.
You’ve defined the operating system—now pressure-test it with real signals before the next milestone. Take a TrueProject Snapshot → get an instant read on early-warning risks, sentiment drift, and variance hotspots across your portfolio.
Business Improvement Techniques: Pick High-Impact Projects, Validate ROI Before You Start
You’ve set direction and cadence; now decide what deserves attention. Treat selection as an improvement method—not a meeting.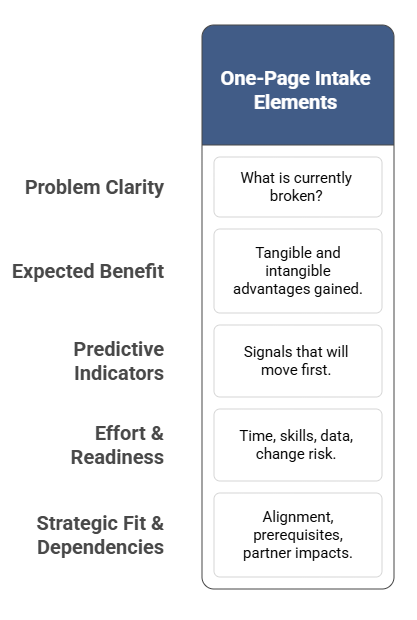
One-page intake (used by every team)
- Problem clarity — What’s breaking now? (lead time, rework, margin, sentiment)
- Expected benefit — Tangible (hours saved, cost avoided, revenue retained) and intangible (NPS, compliance, risk reduction)
- Predictive indicators — The signals you expect to move first (queue age, cycle time, forecast variance, risk-score trend)
- Effort & readiness — Time, skills, data availability, change risk
- Strategic fit & dependencies — Objective alignment, prerequisites, partner impacts
Tip: Pair each indicator with a quiet alert and an owner. If the signal bends, the play is pre-decided—policy, SOP, or automation—so action is immediate, not debated.
Decision scorecard (0–5 each)
Benefit • Feasibility • Readiness • Strategic fit • Change risk (inverse)
Decision rule
Green-light the few you can deliver in ~90 days; defer the rest. Publish the “stop list” with approvals so capacity is real.
Design for proof (before you start)
Baseline the metric(s); define leading signals and owners; schedule a day-one mid-project check; validate benefits post-project and record what became a rule (policy/SOP/BPM/automation).
Portfolio shape
Balance quick wins (weeks) with structural fixes (handoffs, approvals, acceptance criteria). Every project is pilotable, reversible if signals worsen, and embeddable if it works.
Governance that speeds decisions
- Gate 0 (readiness): Hypothesis clear, scope small, owner named, indicator defined.
- Gate 1 (signal check): Did a leading indicator move? If not, cut or adjust.
- Gate 2 (embed): Is the change codified in policy/SOP/automation? If not, it isn’t finished.
Selection favors the prepared: you’ve got the intake, scoring, and gates—now it’s about accelerating the first wave. That's where the TrueProject SnapShot comes in → stand up indicators, alerts, and owners in days, not weeks.
With the right projects selected, execution should be disciplined and quiet—the eight methods below earn their place by moving a defined signal and leaving a durable rule.
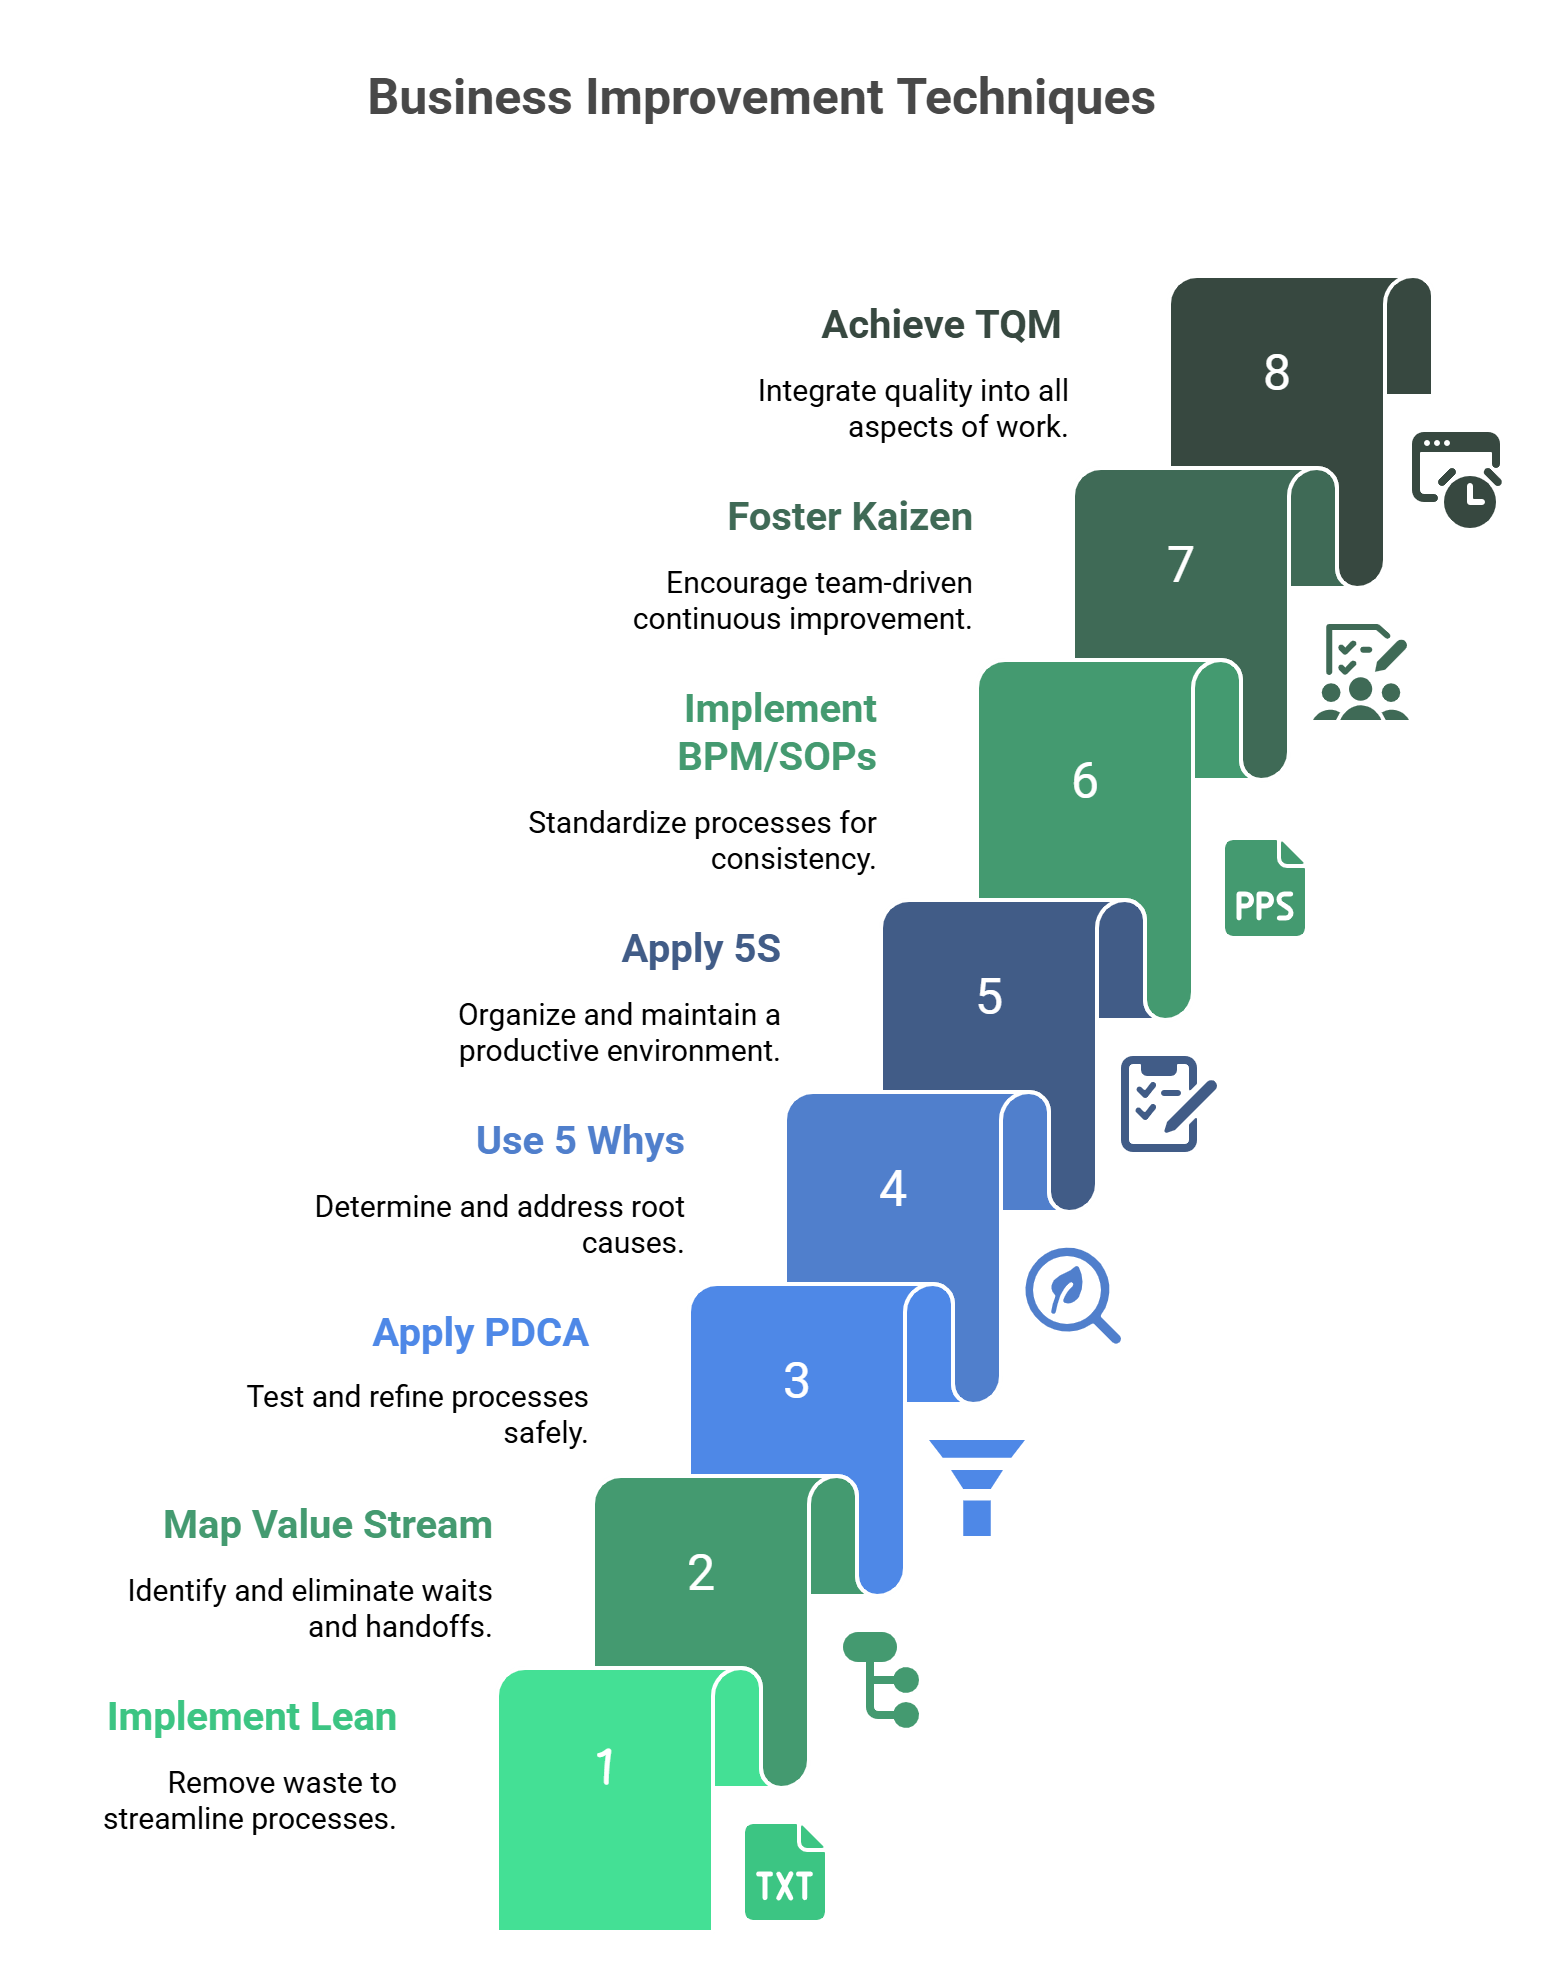
Business Improvement Techniques: Eight Methods That Scale
With the right portfolio selected, execution should be disciplined and quiet. Each method earns its place by moving a defined signal and leaving a durable rule in the system.
1) Lean — remove waste at the source
Deploy: Map one high-impact flow; label value-added vs. non-value-added steps; cap Work-in-Process (WIP); publish queue Service Level Expectations (SLEs).
Signal: Queue-age trend vs. SLE; WIP spikes before throughput dips.
Checkpoint: Which step removal shortened lead time this month?
2) Kaizen — everyday, compounding wins
Deploy: Two actionable ideas per sprint; five-minute demo-day review; recognize adopted ideas.
Signal: Time-to-merge and handoff bounce-backs flag next week’s Kaizen.
Checkpoint: Which adoption moved a metric in 14 days?
3) Plan–Do–Check–Act (PDCA) — low-risk experimentation
Deploy: Plan a change + leading indicator; two-week pilot in a contained slice; Check/Act with a pre-agreed stop rule.
Signal: Threshold breach (variance drift or queue-age anomaly) triggers keep/adjust/roll back.
Checkpoint: Who owns the Act decision—and by when?
4) 5 Whys — fix causes, not symptoms
Deploy: Convene the doers; ask “why” to a controllable lever (policy, SOP, tool, skill); convert the countermeasure into the system; re-sample in 30 days.
Signal: Pattern clues (e.g., rework spikes after code review) guide the workshop.
Checkpoint: What changed in policy/SOP—and did the fix hold?
5) 5S & visual management — make work obvious
Deploy: Standardize naming and owners; archive stale artifacts; show SLEs, thresholds, owners; add simple rules (“PRs > 48h → escalate”). Use a Service Level Expectation (SLE)—a probabilistic time forecast (e.g., “85% in ≤ 4 days”)—to set visible expectations and trigger alerts
Signal: Stale-item detection; freshness checks; trend arrows on tiles.
Checkpoint: Can any leader glance at the board and see what’s waiting, how long, and who moves it?
6) Value stream mapping & flow analysis — cut handoffs
Deploy: Quantify cycle time, queue age, handoff count; remove low-value steps; resequence approvals; set explicit handoff criteria; re-map in 60 days.
Signal: Queue anomalies and handoff bounce-backs; waiting-vs-doing ratio.
Checkpoint: What share of lead time is waiting—and which change reduced it?
7) Business Process Management (BPM) & Standard Operating Procedures (SOPs) — make wins the new normal
Deploy: When a pilot works, update the SOP that week; tag owners; add the step to workflow automation; audit for drift.
Signal: Compliance alerts when steps are skipped or out of sequence.
Checkpoint: Which pilot is now codified—and where is verification automated?
8) Total Quality Management (TQM) — make quality everyone’s job
Deploy: Write a clear “first-time-right” definition; review shared quality objectives together; tie outcomes to benefit realization.
Signal: Correlate sentiment drift with defect/rework trends; intervene early.
Checkpoint: Which cross-team change moved a customer-felt quality measure?
Connect these methods to live, forward-looking signals so you act before risks land—without adding overhead.
Methods only matter if they move a signal and leave a rule behind. To see that loop in action, schedule a 20-minute TrueProject demo → watch Lean, PDCA, and SOP checks run on live, predictive signals.
Where Predictive Intelligence Multiplies the Gains
Short cycles, visible evidence, predefined decisions.
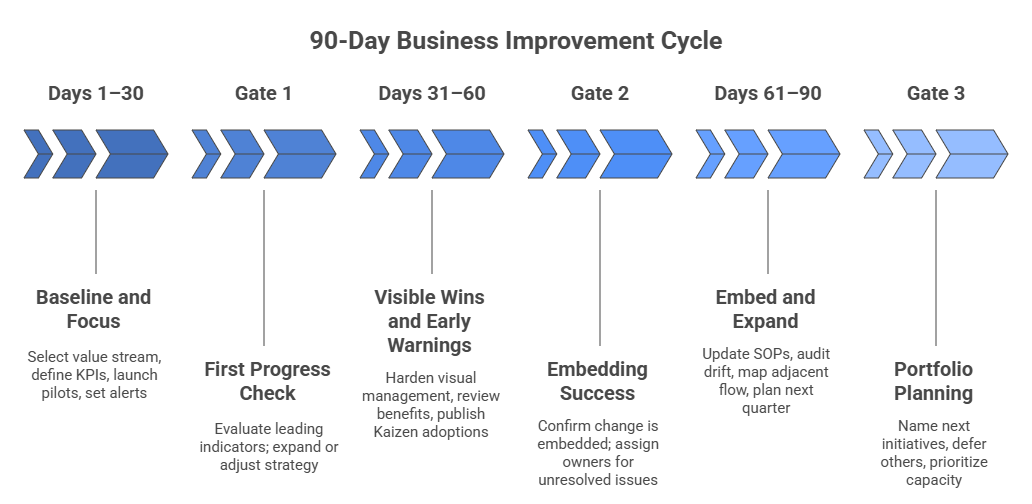
Days 1–30 — Baseline and focus
Choose one value stream; defer two others. Publish three KPIs with named owners and plain definitions. Approve two PDCA pilots with clear stop rules and publicly park one proposal to signal prioritization. Enable two quiet alerts (e.g., queue-age vs. SLE; sentiment drift) and agree the response (policy/SOP/automation).
Gate 1: Has at least one leading indicator bent in the right direction? If yes, expand. If no, adjust or stop and reallocate.
Days 31–60 — Visible wins and early warnings
Harden visual management (thresholds visible, routing explicit). Run a mid-project benefit review; refine scope if signals are soft. Publish Kaizen adoptions, not idea volume.
Gate 2: Has a successful change been embedded (SOP, rule, or automation)? If not, it’s not a win yet—assign owners and a date to embed or retire.
Days 61–90 — Embed and expand
Update SOPs; run a light drift audit; fix “as-imagined vs. as-performed” gaps. Map one adjacent flow using the same cadence. Publish a one-page benefit realization note (estimated vs. realized; tangible + intangible). Shape next quarter’s portfolio using the same intake, scoring, and alerts.
Gate 3: Name the next two initiatives; defer the rest. Capacity is a strategy, not a wish.
The small, consequential metrics leaders actually use—each with an owner, a trigger, and the first move—plus concise proof that the system works.
Your cadence is set—now tailor the gates, alerts, and metrics to your context with a working session. Schedule a discussion → align the plan to your value streams and decide what ships first.
Business Improvement Techniques - Metrics leaders actually use
Keep the slate small and consequential. Every metric has an owner, a trigger, and the first move.
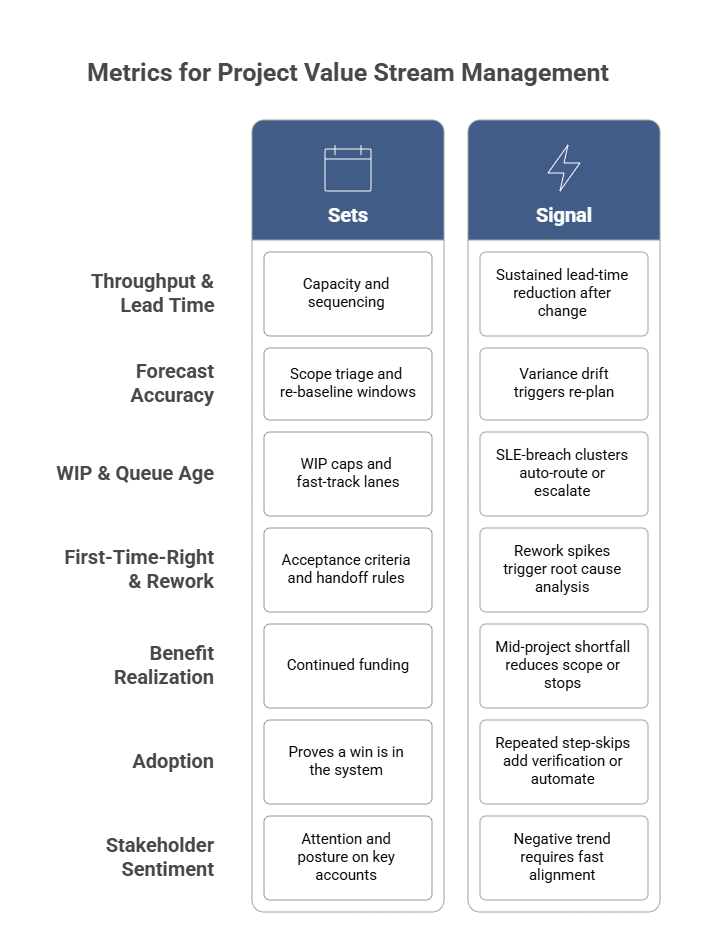
- Throughput & lead time (by value stream) — sets capacity and sequencing.
Signal: sustained lead-time reduction after a Lean/VSM change; alert if the age-at-risk ratio worsens. - Forecast accuracy (scope, schedule, cost) — sets scope triage and re-baseline windows.
Signal: variance drift across two consecutive intervals triggers the re-plan. - Work-in-Process (WIP) & queue age (anchored to Service Level Expectations, SLEs) — sets WIP caps and fast-track lanes.
Signal: SLE-breach clusters auto-route or escalate. - First-time-right & rework rate — sets acceptance criteria and handoff rules.
Signal: rework spikes around specific steps → run 5 Whys and update the SOP. - Benefit realization (estimated vs. realized, quarterly) — sets continued funding.
Signal: mid-project shortfall → reduce scope or stop. - Adoption (SOP compliance, Kaizen adoption) — proves a win is in the system.
Signal: repeated step-skips → add verification or automate. - Stakeholder sentiment (internal + client) — sets attention and posture on key accounts.
Signal: three-day negative trend with flat delivery metrics → fast alignment ritual.
With these in place, the “proof” becomes visible in day-to-day operations—not just in end-of-quarter reports.
How To Tell Business Improvement Techniques Are Working (No Scorecard Needed)
- Early warnings. Alerts fire on variance drift, queue age, or sentiment—and the predefined play (policy/SOP/automation) executes before milestones slip.
- Standards hold. New rules appear in automation/SOP logs; drift alerts drop and stay down across cycles.
- Flow improves. Waiting time shrinks, handoffs decrease, and rework touches fall on the mapped value stream.
- PDCA is visible. Pilots open/close on schedule; keep/adjust/roll-back decisions are recorded and adopted.
- Customer signals align. Sentiment trends track with delivery health; exceptions trigger a short, scripted alignment ritual.
Now, see how these same patterns translate into measurable wins in typical project scenarios.
Industry Examples with Quick “Benefit Math”
Change-request overload
- Before: Two approval loops; median queue age 5 days; first-time-right 82%; ~15 CRs/week.
- Change: PDCA collapsed approvals into a single gate with clear criteria; ownership rotates weekly.
- After: Queue age 2.5 days; first-time-right 93%; volume steady.
- Benefit (quarter): ≈ 488 days of lead time removed (2.5 × 15 × 13) and ≈ 120 engineering hours saved (conservative).
- Signal → Action: Queue-age breach vs. SLE triggers fast-track routing; trend reviewed weekly.
Client onboarding slippage
- Finding: Lean/VSM identified environment access as the longest wait.
- Change: BPM added automated pre-provisioning at contract sign-off; the board flags any access ticket beyond the promise window.
- Result: Tighter forecast variance; early NPS lift.
- Signal → Action: Access-ticket age becomes a leading indicator; breaches auto-notify the owner and route to a fast-track lane.
Release cadence unpredictability
- Finding: Mapping exposed late test environments and unclear rollback criteria.
- Change: SOP codified rollback pre-checks; PDCA piloted a short staging-freeze window; alert fires on adverse change-failure trend.
- Result: More predictable releases, fewer incidents, steadier customer sentiment.
- Signal → Action: Two consecutive change-failure breaches trigger a targeted root-cause session and temporary controls until the rate returns to band.
Conclusion
In high-stakes delivery, business improvement techniques turn leadership from intent to control: pick fewer, provable bets; test safely; embed what works; watch for drift. The unlock is foresight—quiet, leading signals that let you act before outcomes slip and keep the loop tight: Select → Pilot → Check → Embed → Monitor → Validate. Methods stop being workshops; they become the way work runs.
This is where TrueProject fits. Operating as a KPI-driven intelligence layer, it delivers early warnings before issues escalate, a continuous read on stakeholder sentiment to surface hidden friction, and risk-aware recommendations mapped to policy, SOP, or automation. Portfolio to project, it clarifies what to act on, who owns it, and how to verify the gain—so you move from explaining misses to controlling outcomes with confidence, consistency, and command.
If this is the level of control and foresight you want from your projects, the next step is simple - Request a TrueProject demo → turn early warnings into finished work and verified benefits.
FAQs
1) What are business improvement techniques in project management?
Structured methods—Lean, Kaizen, Plan–Do–Check–Act (PDCA), 5 Whys, 5S/visual management, value stream mapping, BPM/SOPs, and TQM—that cut waste, stabilize project quality, and make delivery predictable across projects and portfolios.
2) Which business improvement techniques should B2B SaaS/PSA PMOs start with?
Begin with value stream mapping (expose waits/hand-offs), PDCA (safe pilots), and 5S/visual management (make status obvious). Then lock wins with BPM/SOPs, use Lean WIP/SLEs to control flow, and align quality via TQM.
3) How does predictive intelligence enhance business improvement techniques?
It provides early warning signals—variance drift, queue-age anomalies, sentiment shifts—and triggers predefined actions (policy/SOP/automation), turning improvement from reactive fixes into timely, guided decisions.
4) How do I select the right improvement projects fast?
Use a one-page intake scored on benefit, feasibility, readiness, strategic fit, and change risk (inverse). Fund what can land in ~90 days, pair each with leading indicators and owners, defer the rest.
5) What metrics prove business improvement techniques are working?
Track throughput & lead time, forecast accuracy, WIP & queue age (SLE-anchored), first-time-right & rework rate, benefit realization, SOP/Kaizen adoption, and stakeholder sentiment tied to delivery health.