

Every project manager knows the anxiety when a project starts to veer off course—budgets spiraling, deadlines slipping, and team alignment faltering. Imagine being blindsided by these issues because you lacked the right tools to foresee them. In today’s high-stakes business environment, where a single failed project can cost millions, the pressure to deliver results is relentless. But what if you could identify the warning signs before they escalate into full-blown disasters?
Business intelligence dashboards are your shield against project failure. These powerful tools transform raw data into crystal-clear insights, enabling you to monitor key performance indicators (KPIs), anticipate risks, and make informed decisions in real-time. This isn’t about managing data; it’s about leveraging predictive insights to stay ahead of the curve and ensure your projects meet and exceed expectations.
In this article, we’ll explore how business intelligence dashboards can revolutionize your project management approach, identify the pain points they address, and examine the critical features that make them indispensable in today’s business landscape. Whether you’re struggling with scattered data, sluggish decision-making, or project overruns, the right business intelligence dashboards can be the difference between success and failure.
The Pain Points of Modern Project Management
Before diving into the transformative power of business intelligence dashboards, it’s crucial to acknowledge a harsh reality - many projects are set up to fail from the start. Here’s why: 
- Data Overload Without Insight - Project leaders often drown in data from various sources—financial systems, CRM tools, and marketing analytics. Without a centralized platform to aggregate and analyze this data, it’s nearly impossible to derive actionable insights. The result? Missed opportunities, overlooked risks, and decisions based on assumptions feelings rather than solid data.
- Lack of Predictive Capabilities - Traditional project management tools often lack the ability to forecast potential risks or identify patterns in past performance that could signal future issues. This reactive approach leaves leaders scrambling to fix problems rather than preventing them.
- Inefficient Communication and Collaboration - In today’s remote and hybrid work environments, keeping everyone on the same page is more challenging than ever. Disconnected tools and siloed teams lead to miscommunication, duplicated efforts, and, ultimately, project delays.
These pain points aren’t just inconvenient—they’re costly. Projects that fail to deliver on time and within budget can erode client trust, damage your brand’s reputation, and result in significant financial losses. However, it doesn’t have to be this way.
How Business Intelligence Dashboards Turn Data into Decisions
Business intelligence dashboards are transformative tools in project management, providing a centralized, real-time view of critical project data. They help you track performance, spot trends, and make data-driven decisions that enhance project execution and success. Here's how business intelligence dashboards address key project management challenges:
- Centralized Data Access - Business intelligence dashboards consolidate all project-related data—financials, timelines, resource allocation—into one intuitive platform. This eliminates the need for multiple tools, providing clear, actionable insights that save time and improve decision quality.
- Predictive Analytics - Beyond data visualization, business intelligence dashboards leverage AI and machine learning to predict future outcomes. By analyzing patterns, they identify potential risks early, allowing project managers to proactively adjust resources, timelines, and strategies to prevent issues.
- Enhanced Team Collaboration - Business intelligence dashboards provide a unified data source, accessible to all team members and stakeholders in real-time. This transparency reduces miscommunication, improves alignment, and fosters a collaborative environment essential for project success.
- Real-Time Decision Making - With continuous updates, business intelligence dashboards offer the most current data, enabling quick, informed decision-making. This agility helps project managers respond swiftly to changes, keeping projects on track and aligned with business objectives.
- Improved Communication - Dashboards streamline communication by presenting data in a clear, easy-to-understand format. Whether working in-office or remotely, teams stay connected, informed, and focused on shared project goals.
Integrating a business intelligence dashboard into your project management process equips you with the tools to anticipate challenges, optimize team performance, and drive successful project outcomes through data-driven insights.
The Key Elements of an Effective Business Intelligence Dashboard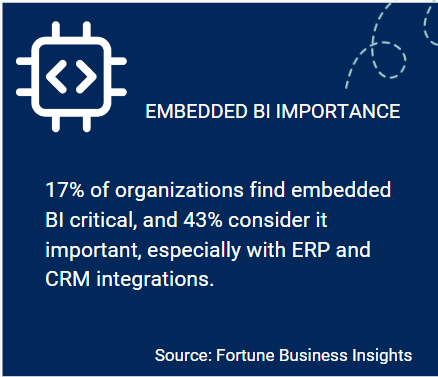
Business intelligence dashboards are essential for effective project management, transforming complex data into clear, actionable insights that facilitate quick decision-making and help identify trends and issues. Instead of sifting through millions of data rows, these dashboards empower project managers to make informed decisions and align projects with strategic goals effectively. To maximize their potential, business intelligence dashboards must have the right features and capabilities:
- Ease of Use - Dashboards should be intuitive and user-friendly, allowing all team members to access insights without a steep learning curve.
- Customizable Layout - Flexibility in design is essential; dashboards must be customizable to display the most relevant data based on specific project needs, enhancing user experience.
- Diverse Data Visualizations – Multiple visualization options, such as charts, heatmaps, and scatter plots, allow teams to view data in formats that best communicate insights.
- Real-Time Insights - Real-time data analytic updates enable immediate responses to project changes, which is crucial for tracking KPIs and meeting milestones efficiently.
- Interactive Features - Features like drill-down capabilities and data filtering help users explore data deeper, aiding in root cause analysis and improving decision-intelligence.
- Integration with Data Sources - Seamless integration with existing tools (CRM, ERP, financial systems) ensures a comprehensive view of project health by pulling all relevant data into one place.
Benefits of Business Intelligence Dashboards
Business intelligence dashboards offer numerous benefits that directly impact project success, such as:
- Improved Decision-Making - Real-time insights and predictive analytics help project managers make timely, data-driven decisions, keeping projects aligned with strategic objectives.
- Increased Efficiency - Automation of data collection and analysis reduces manual work, freeing teams to focus on critical tasks and accelerating project timelines.
- Risk Mitigation - Predictive insights identify potential risks early, allowing proactive adjustments to prevent disruptions and keep projects within scope with continuous risk monitoring.
- Enhanced Collaboration - A centralized data platform improves communication, ensuring all team members access the same information and work toward shared goals.
- Strategic Alignment - By tracking key performance indicators, business intelligence dashboards ensure that projects support broader organizational goals, enabling adjustments when necessary.
- Accurate Data Analysis - High-quality data analysis is critical for making reliable decisions that drive project success. Maintaining data quality upstream is essential for valuable insights.
Integrating business intelligence dashboards into your project management approach provides a real-time, comprehensive view of your projects, enhancing your ability to foresee, manage, and resolve potential issues effectively, ensuring successful project execution and optimized project value delivery.
Common Challenges with Implementing Business Intelligence Dashboards
Despite their many benefits, implementing business intelligence dashboards is not without its challenges. Here are some common hurdles and how to overcome them:
- Data Literacy - Not all team members may be comfortable working with data, which can hinder the effective use of business intelligence dashboards. Providing training and support is crucial to ensure that all stakeholders can leverage the dashboard’s full capabilities and access it as a single source of truth.
- Data Quality - The accuracy of the insights provided by Business Intelligence Dashboards depends on the quality of the data it analyzes. Ensuring that your data sources are clean, reliable, and consistently updated is essential for maintaining the integrity of your dashboard.
- Design Complexity - A poorly designed dashboard can be just as ineffective as not having one at all. It’s important to strike a balance between providing comprehensive data and maintaining a user-friendly interface. Engaging both designers and data analysts in the dashboard’s development process can help achieve this balance.
Best Practices for Designing a Business Intelligence Dashboard
To maximize the effectiveness of your business intelligence dashboards, follow these design principles -
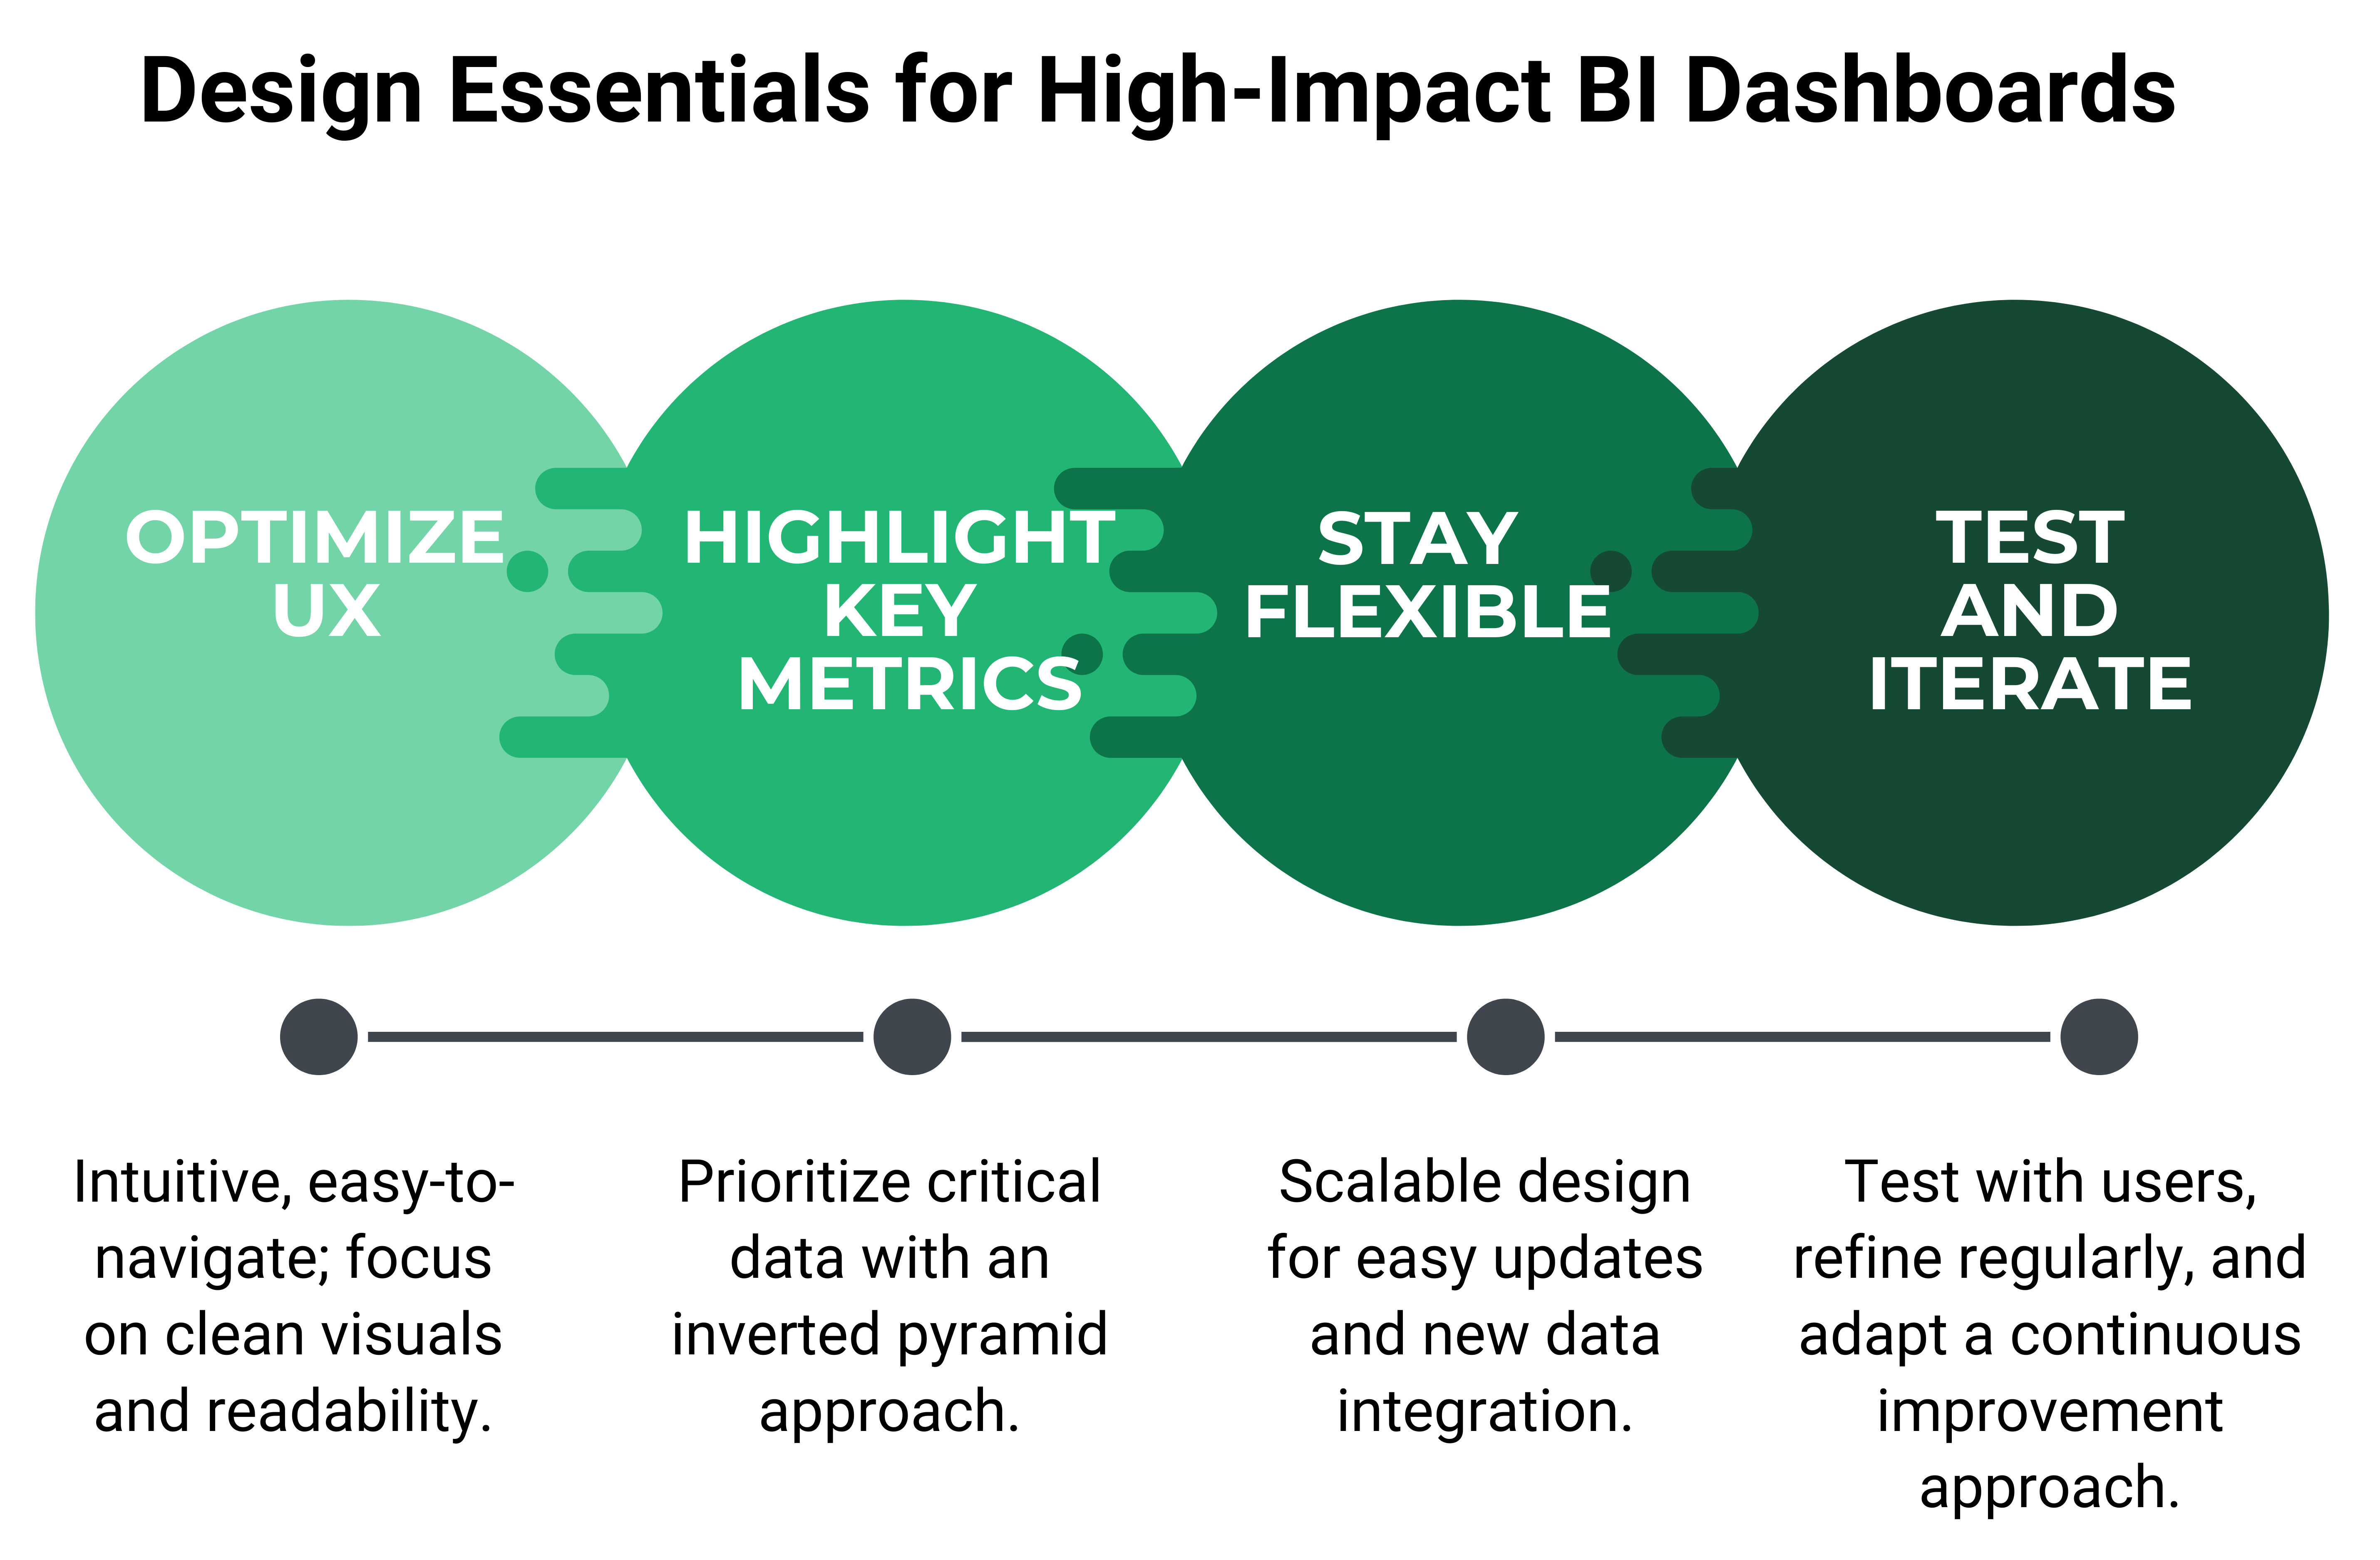
- Prioritize User Experience (UX) - The dashboard should be easy to navigate, with logical data flows and intuitive controls. Pay attention to visual hierarchy, color schemes, and font choices to enhance readability and reduce eye strain.
- Focus on the Most Important Metrics - Highlight the most critical data points. Use the inverted pyramid method to present the most important information first, followed by secondary details. This approach ensures that users can quickly grasp the key insights without being overwhelmed.
- Ensure Flexibility and Scalability - Your business intelligence dashboards should be flexible enough to grow with your needs. as your projects evolve, the dashboard should allow for easy updates and the addition of new data sources or visualizations.
- Test and Iterate - Involve end-users in the testing phase to gather feedback and make necessary adjustments. Regularly review and update the dashboard to ensure it continues to meet your team’s needs as your projects progress.
Transform Your Project Management with Predictive Insights
In today’s high-stakes business environment, business intelligence dashboards are no longer optional—they are essential tools that transform raw data into actionable insights, empowering you to spot risks, make informed decisions, and keep your projects on track. The right business intelligence dashboards consolidate critical data in real-time, enhancing decision-making, streamlining communication, and boosting team collaboration to ensure projects are completed on time and within budget. To thrive in a data-driven world, project managers need the power of predictive analytics to stay ahead of challenges and turn potential failures into remarkable projects or business successes.
Predictive project management is the next evolution in data-driven oversight. TrueProject takes this to the next level by offering a powerful, KPI-based predictive project management solution that integrates seamlessly with business intelligence dashboards. With its AI-driven predictive intelligence, TrueProject proactively identifies issues before they derail your project, providing automated oversight and governance beyond traditional dashboards. Its real-time assessments and automated stakeholder surveys deliver deep insights into project health, aligning team efforts with strategic goals. By integrating TrueProject into your project management toolkit, you elevate your business intelligence dashboards from a data display tool to a comprehensive solution that ensures your projects are always ahead of the curve.
More information on TrueProject at trueprojectinsight.com.

About the Author:
Nisha Antony is an accomplished senior marketing communications specialist at TrueProject and a leader in predictive intelligence. With over 16 years of experience, she has worked as a Senior Analyst at Xchanging, a UK consulting firm, and as an Internal Communications Manager on a major cloud project at TE Connectivity.
She is an insightful storyteller who creates engaging content on AI, machine learning, analytics, governance, project management, cloud platforms, workforce optimization, and leadership.
Endnotes:
- Medium Team. “Role of Business Intelligence Dashboards in Today’s Economy.” Medium - Jul 18, 2024. https -//medium.com/@mokkup/role-of-business-intelligence-dashboards-in-todays-economy-3a09977b0454
- Keller Schroeder. “Business Intelligence & Dashboards.” Keller Schroeder - (n.d.)https -//www.kellerschroeder.com/business-intelligence-dashboards/
- Fortune Business Insights. “Hardware & Software IT Services.” Fortune Business Insights - Aug 12, 2024. https -//www.fortunebusinessinsights.com/business-intelligence-bi-market-103742
- HG Insights. “Business Intelligence Market Landscape in 2024,” HG Insights - Mar 08, 2024.


